From Ascription is an Anathema to any Enthusiasm:
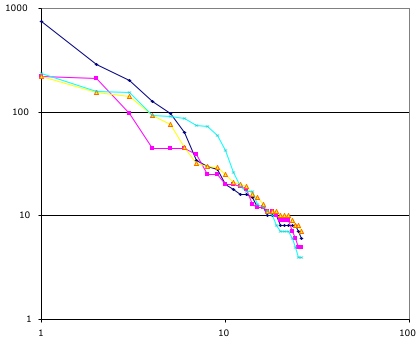
Following up on something Clay mentioned the following chart plots the distribution of tags for four popular URI at del.icio.us. Each line is the tags assigned to one URI. Each point is one tag, the vertical axis is how many times that tag was used to label that URI. The more popular tag for a URI is on the left; the least on the right. Note the power-law distributions.